 Epistemis
Atlas
Biochemistry diagrams
62 cases to look at, with the source of every image. The guided reading of each one is in the app.
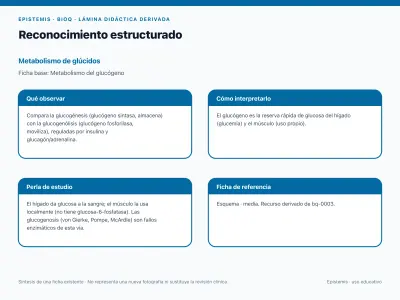
Structured recognition · Glycogen metabolism
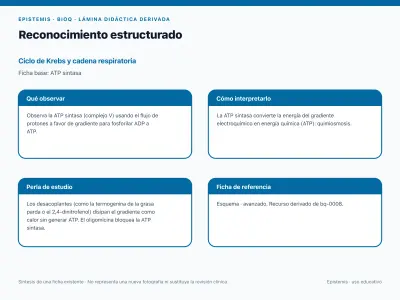
Structured recognition · ATP synthase
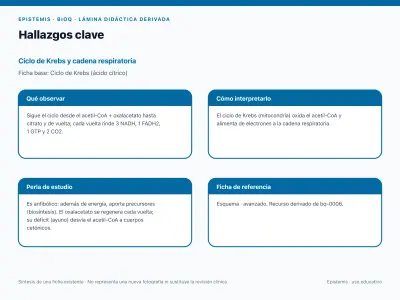
Key findings · Krebs cycle (citric acid)
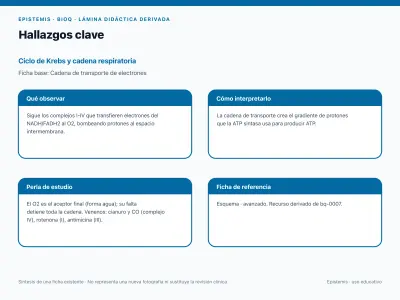
Key findings · Electron transport chain
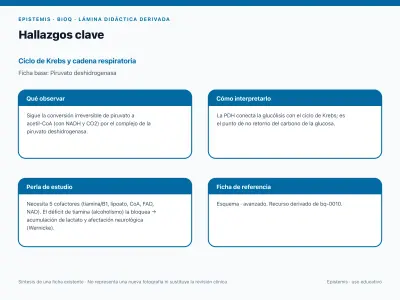
Key findings · Pyruvate dehydrogenase
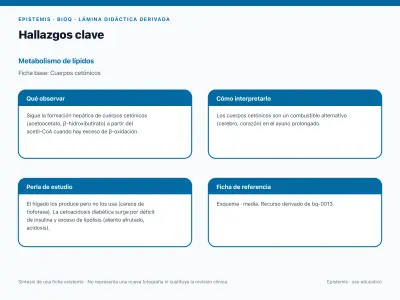
Key findings · Ketone bodies
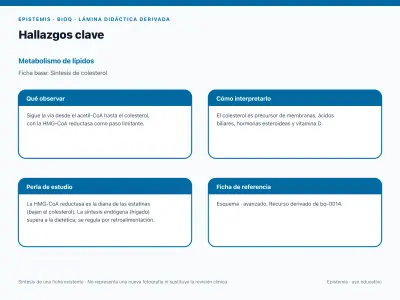
Key findings · Cholesterol biosynthesis
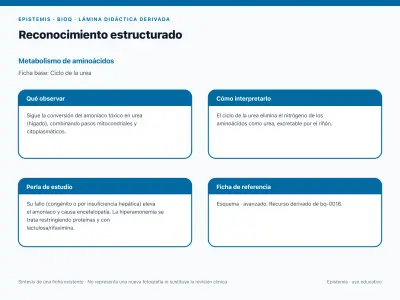
Structured recognition · urea cycle
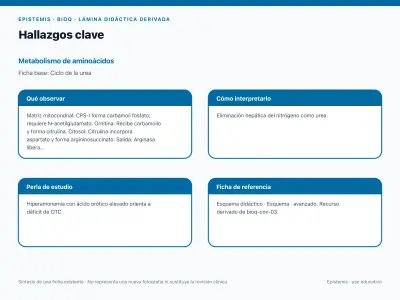
Key findings · urea cycle
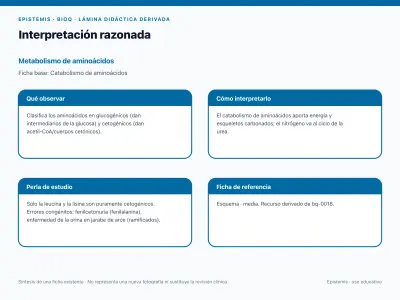
Reasoned interpretation · Amino acid catabolism
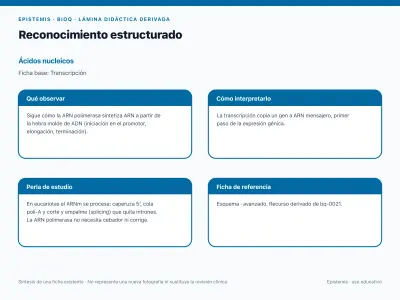
Structured recognition · Transcription
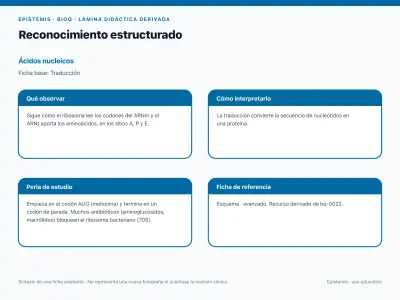
Structured recognition · Translation
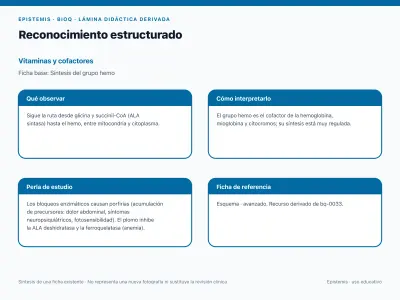
Structured recognition · Synthesis of the heme group
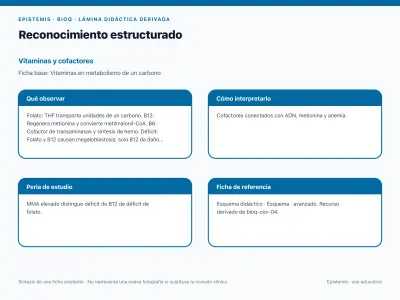
Structured recognition · Vitamins in one-carbon metabolism
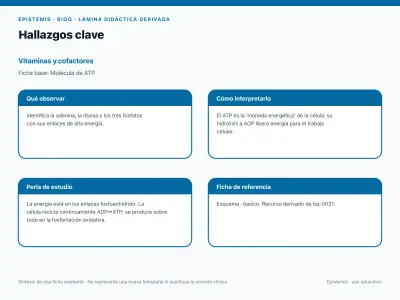
Key findings · ATP molecule
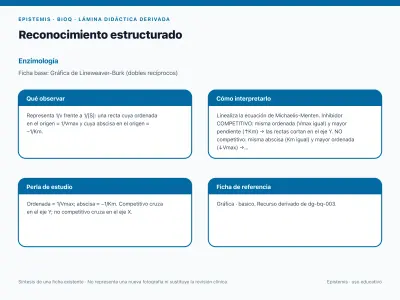
Structured recognition · Lineweaver-Burk plot (reciprocal doubles)
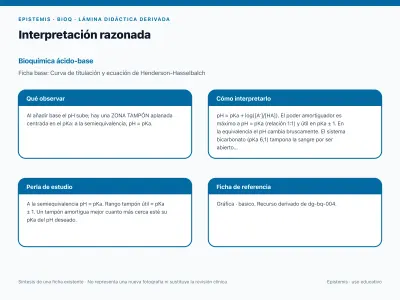
Reasoned interpretation · Titration curve and Henderson-Hasselbalch equation
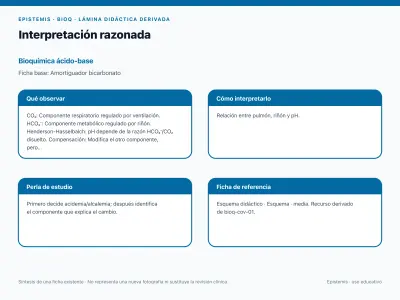
Reasoned interpretation · Bicarbonate buffer
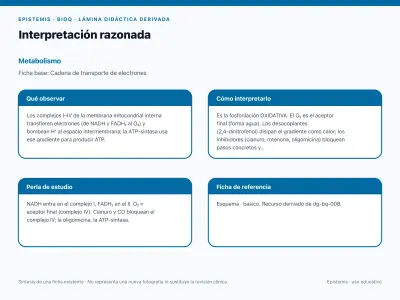
Reasoned interpretation · Electron transport chain
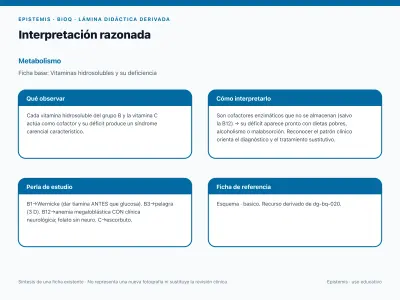
Reasoned interpretation · Water-soluble vitamins and their deficiency
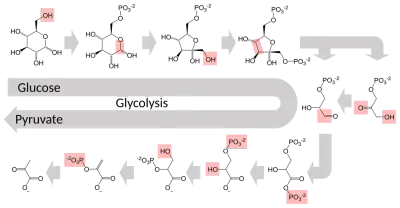
Glycolysis
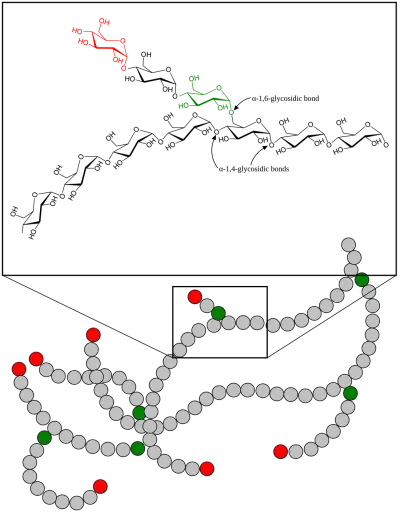
Glycogen metabolism
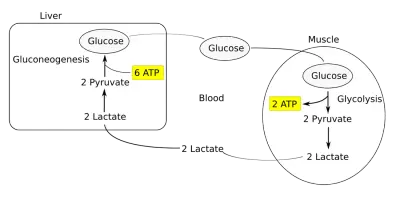
Cori cycle
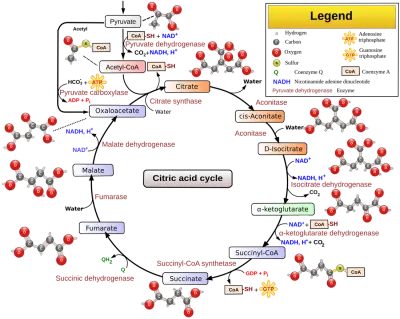
Krebs cycle (citric acid)
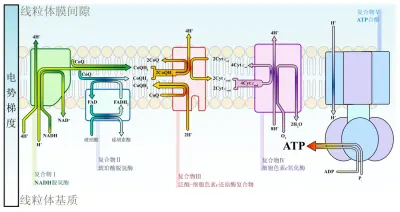
electron transport chain (1 of 2)
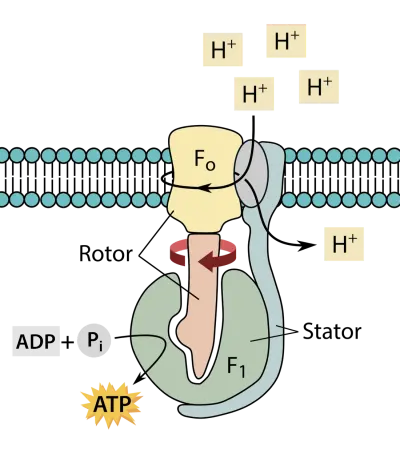
ATP synthase
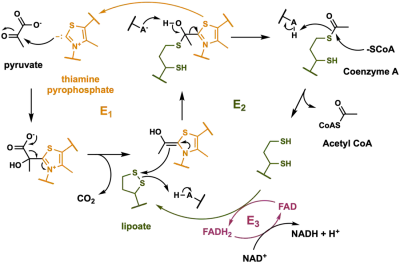
Pyruvate dehydrogenase
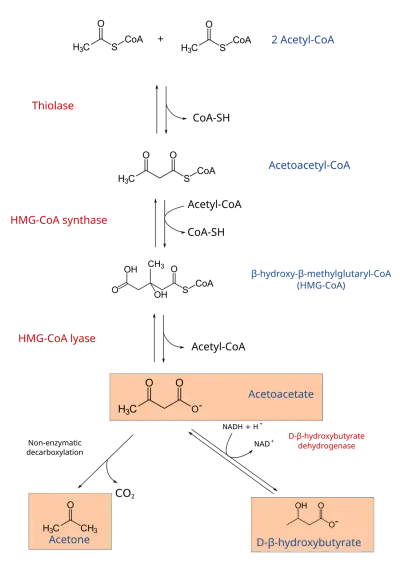
Ketone bodies
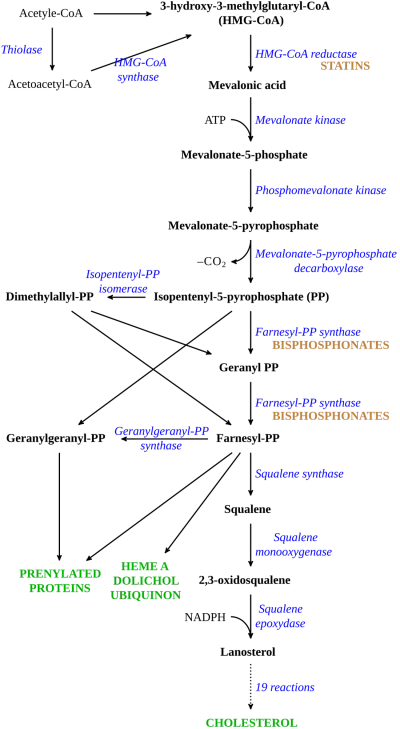
Cholesterol biosynthesis
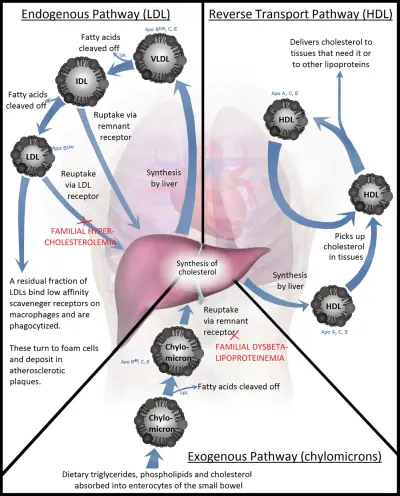
Lipoprotein metabolism
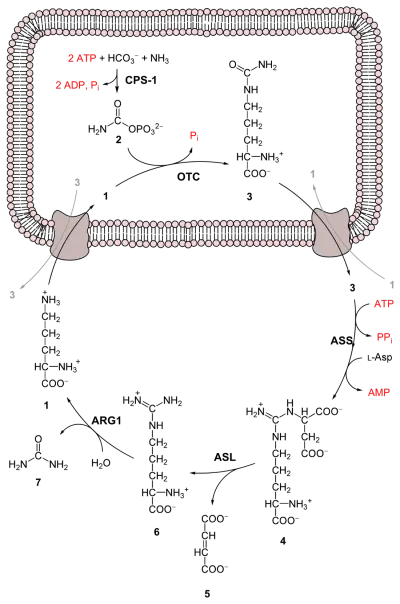
Urea cycle (1 of 2)
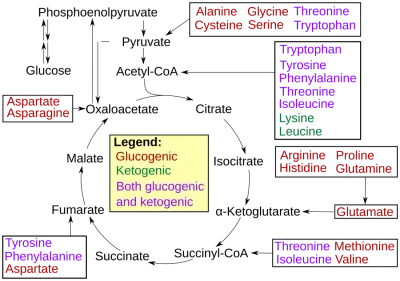
Amino acid catabolism
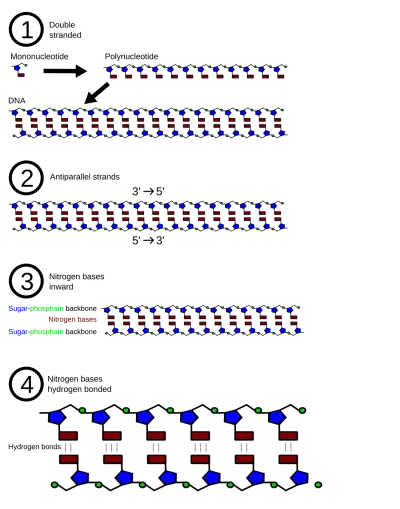
DNA structure
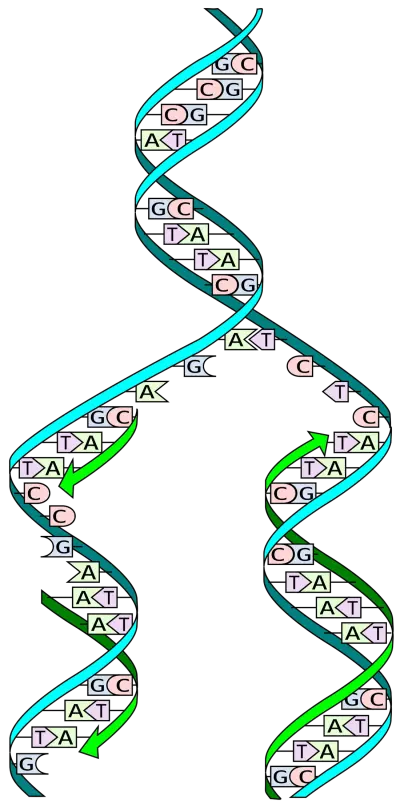
DNA Replication
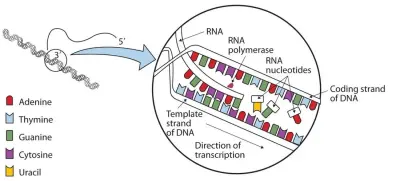
Transcription
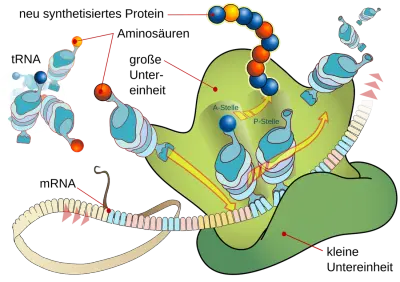
Translation
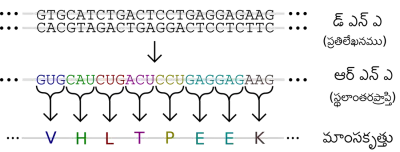
Genetic code
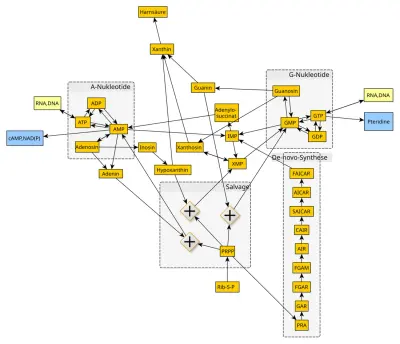
Purine metabolism
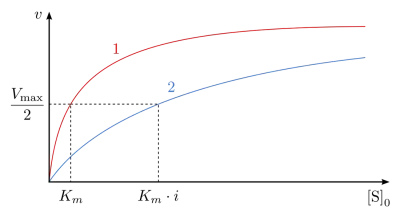
Michaelis-Menten kinetics (1 of 3)
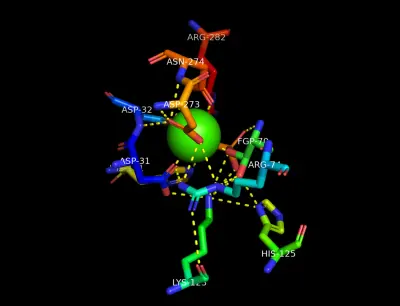
Active site and substrate
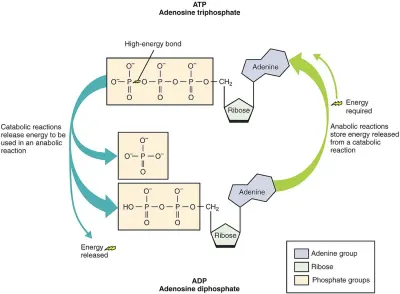
ATP molecule
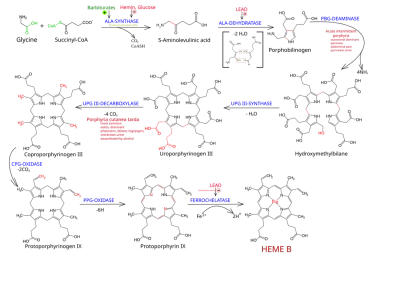
Synthesis of the heme group
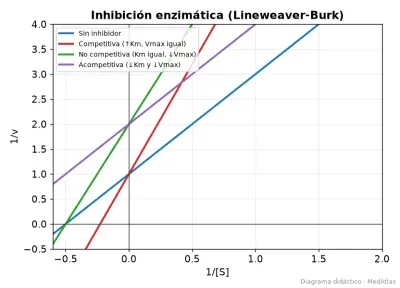
Enzymatic inhibition (Lineweaver-Burk)
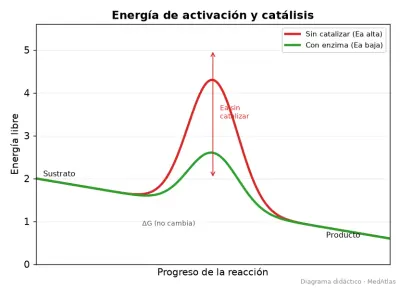
Activation energy and catalysis
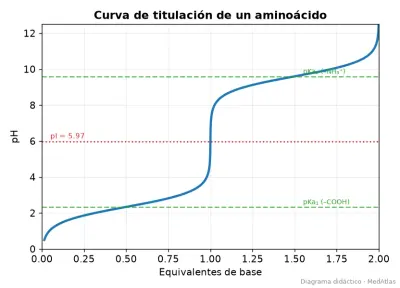
Titration curve of an amino acid
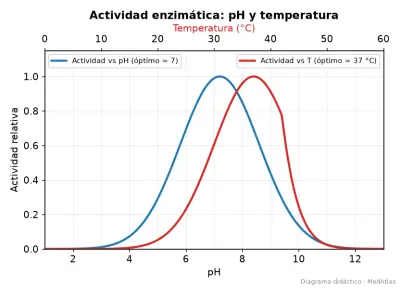
Enzymatic activity: pH and temperature
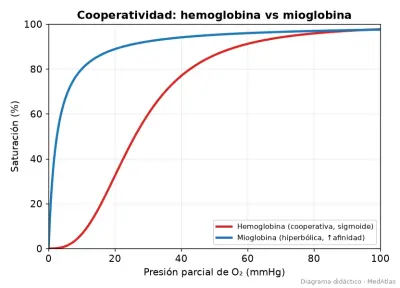
Cooperativeness: hemoglobin vs myoglobin
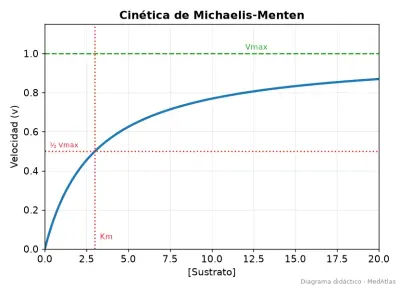
Michaelis-Menten kinetics (2 of 3)
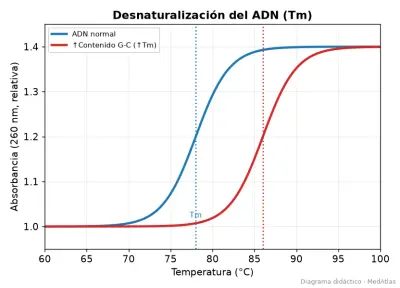
DNA denaturation (Tm)
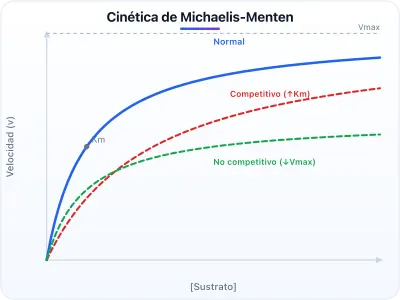
Michaelis-Menten kinetics (3 of 3)
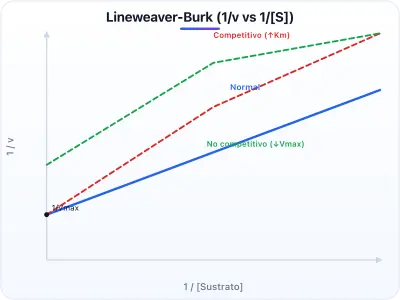
Lineweaver-Burk plot (reciprocal doubles)
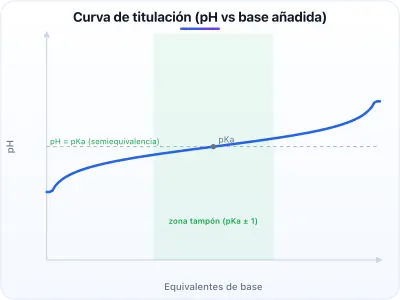
Titration curve and Henderson-Hasselbalch equation
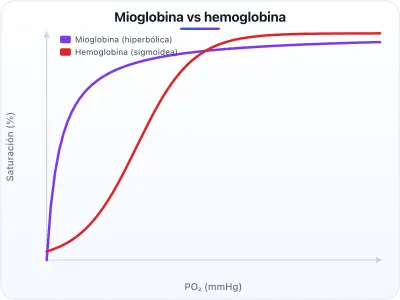
O₂ saturation: myoglobin vs hemoglobin
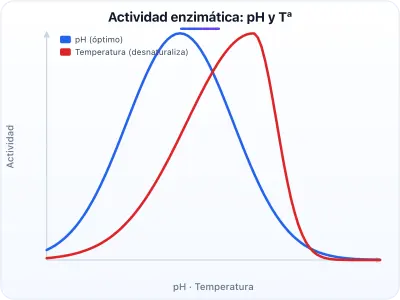
Enzymatic activity: effect of pH and temperature
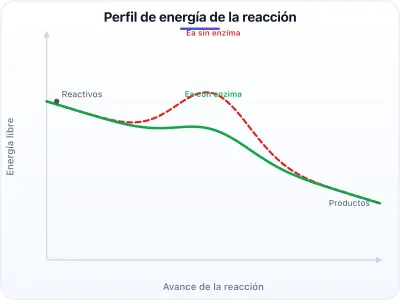
Energy profile and enzyme catalysis
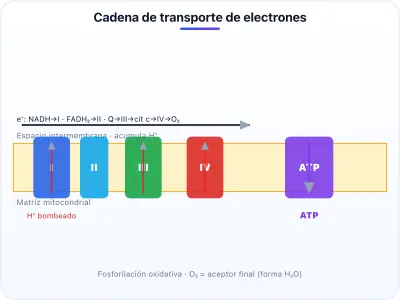
electron transport chain (2 of 2)
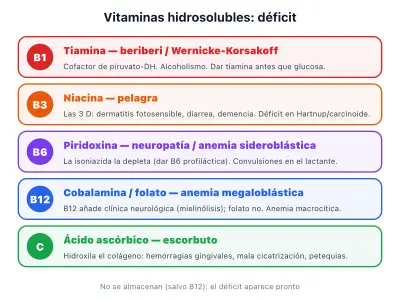
Water-soluble vitamins and their deficiency
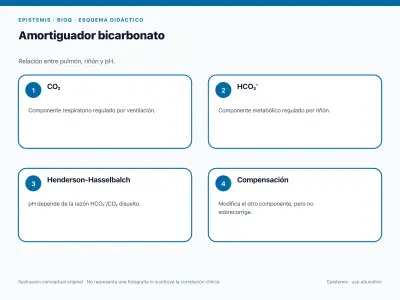
Bicarbonate buffer
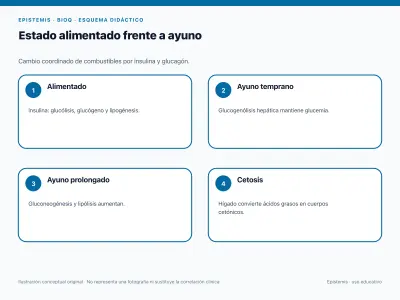
Fed vs. fasting state
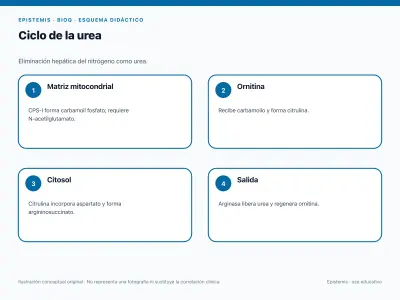
Urea cycle (2 of 2)
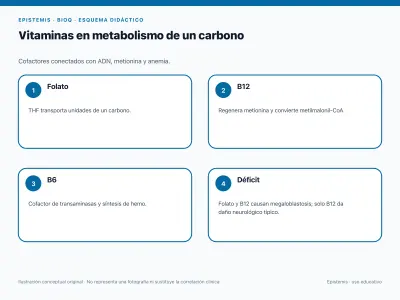
Vitamins in one-carbon metabolism
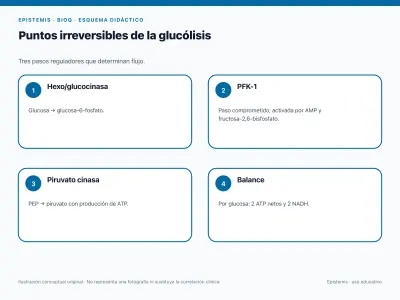
Irreversible steps of glycolysis
No cases match those filters.