 Epistemis
Atlas
Physiology diagrams
76 cases to look at, with the source of every image. The guided reading of each one is in the app.
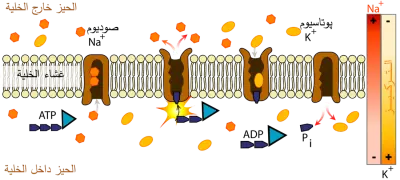
Na⁺/K⁺-ATPase pump
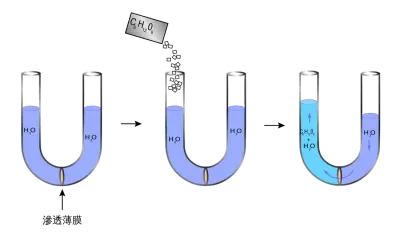
Osmosis
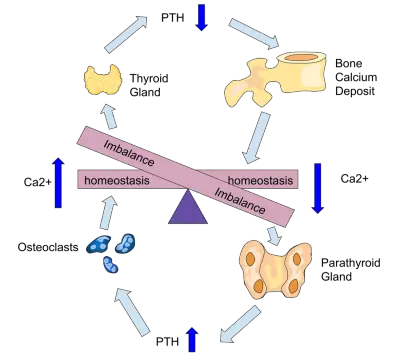
Negative feedback (homeostasis)
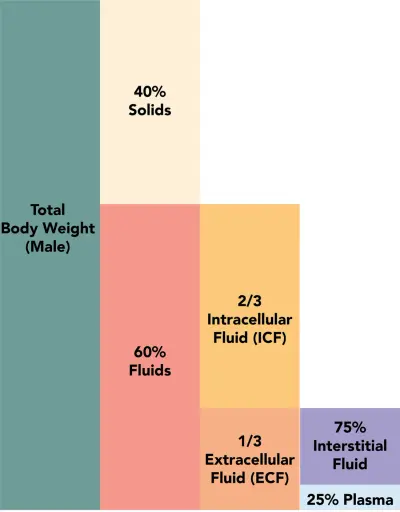
Liquid compartments of the body
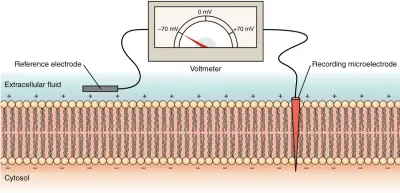
Resting membrane potential
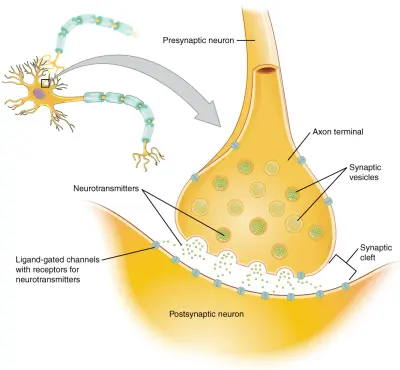
Chemical synapse
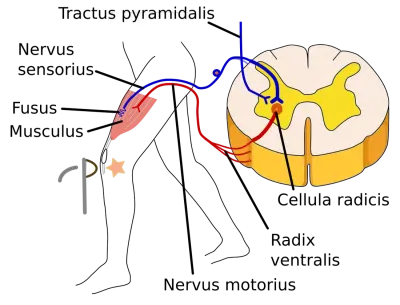
reflex arc
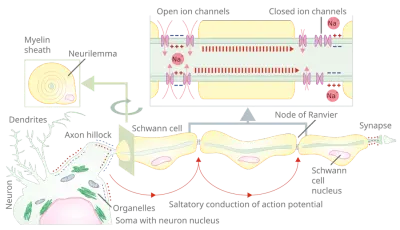
Saltatory conduction
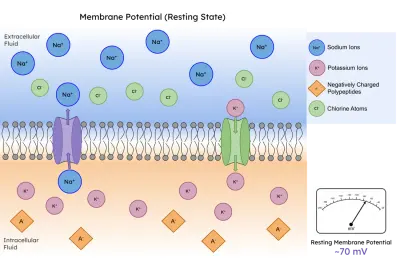
membrane potential
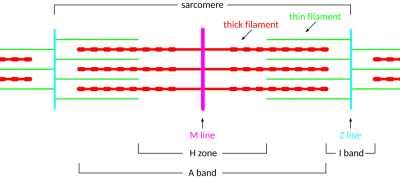
Sarcomere
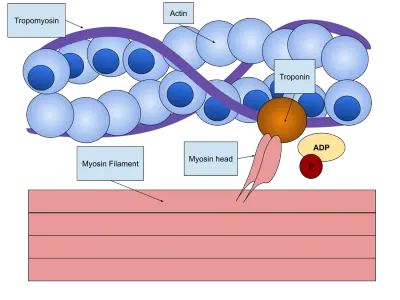
Sliding filament theory
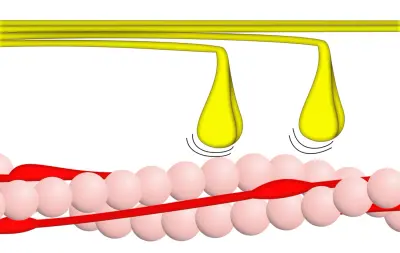
Cycle of crossed bridges
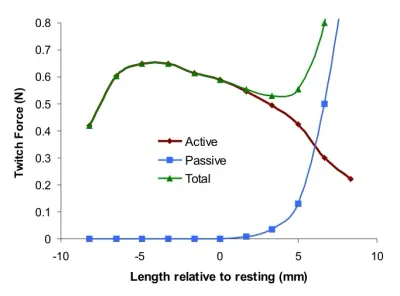
Length-tension curve
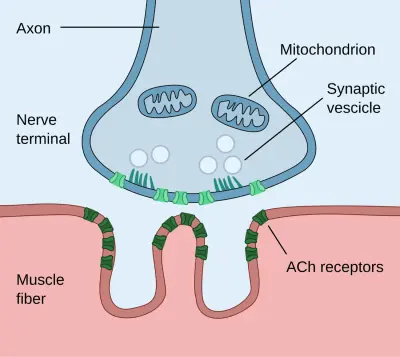
Neuromuscular junction
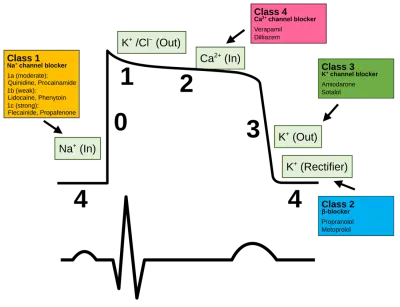
Cardiac action potential (ventricle)
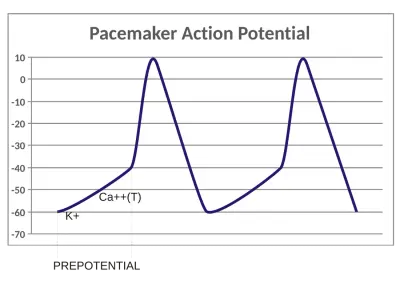
Pacemaker action potential (SA node)
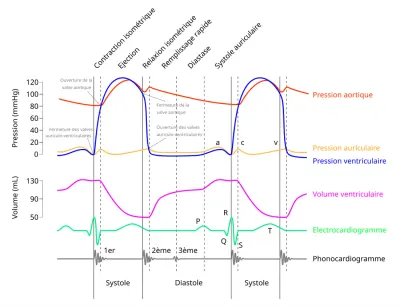
Wiggers diagram (cardiac cycle)
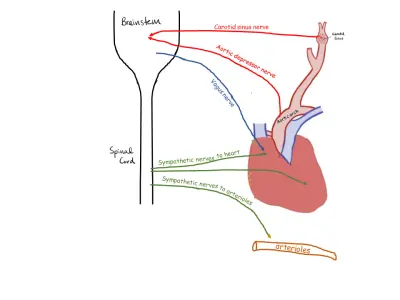
Baroreceptor reflex
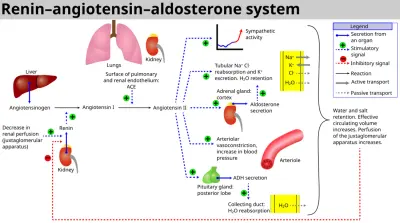
Renin-angiotensin-aldosterone system
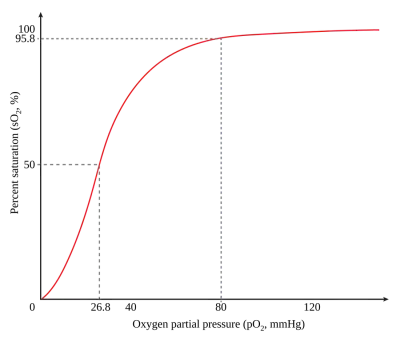
Hemoglobin dissociation curve
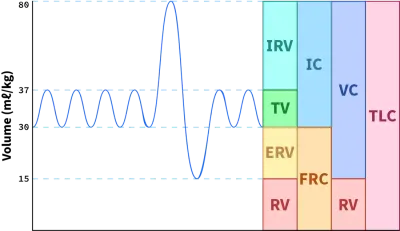
Lung volumes and capacities (1 of 2)
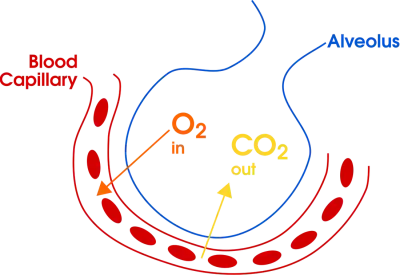
Alveolar gas exchange
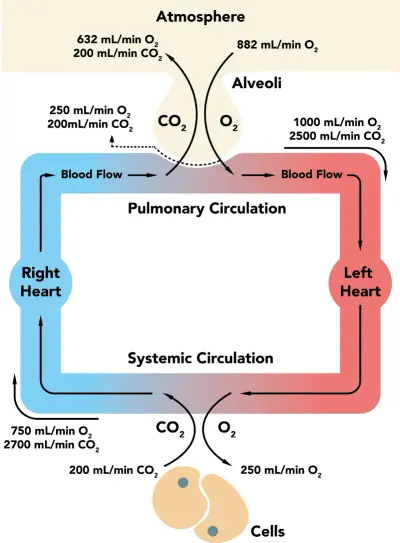
CO₂ transport in blood
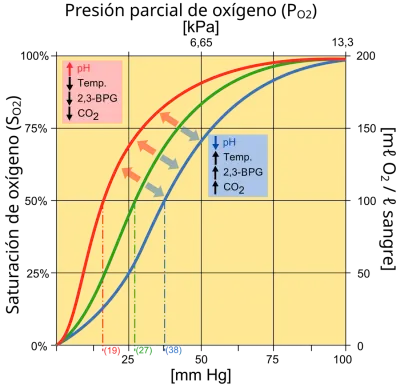
Bohr effect
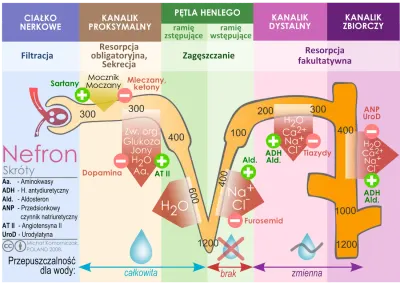
The nephron
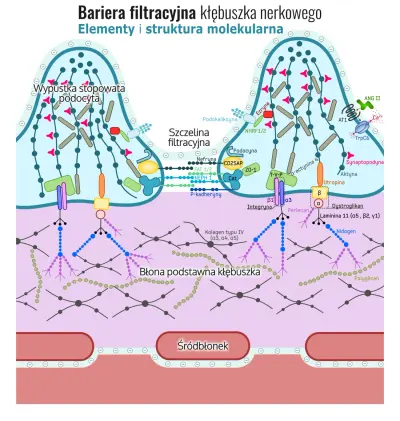
Glomerular filtration
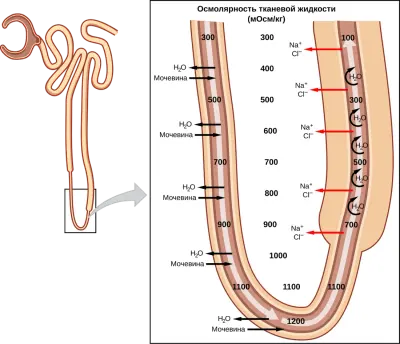
Countercurrent multiplier
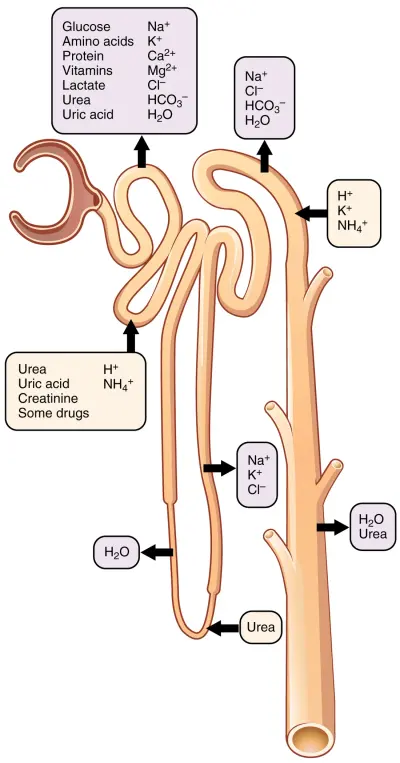
Tubular reabsorption and secretion
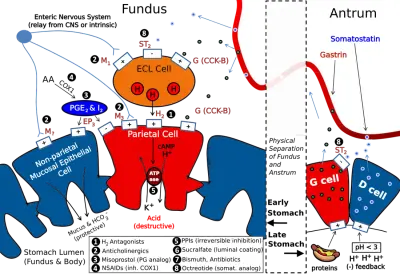
Gastric acid secretion
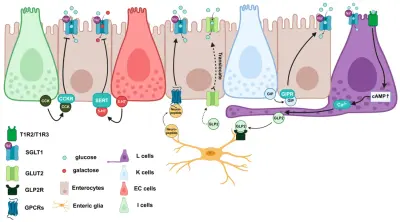
Nutrient absorption
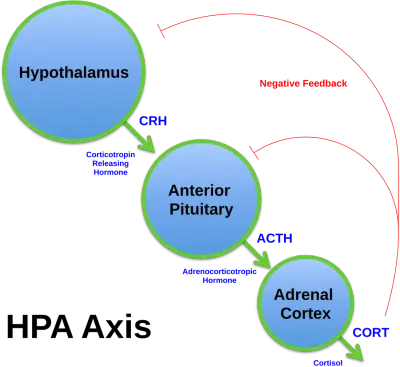
Hypothalamic-pituitary-adrenal axis
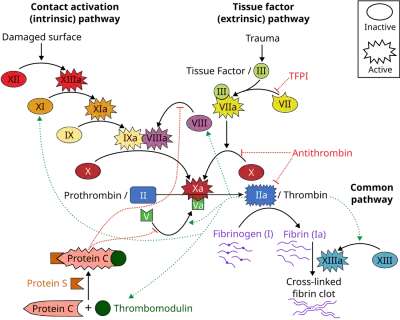
Coagulation waterfall
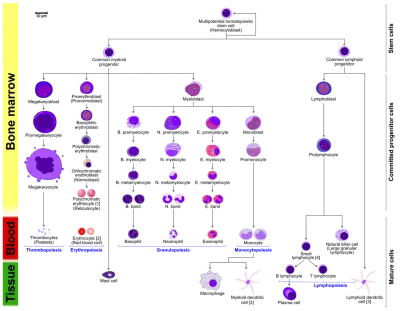
Hematopoiesis
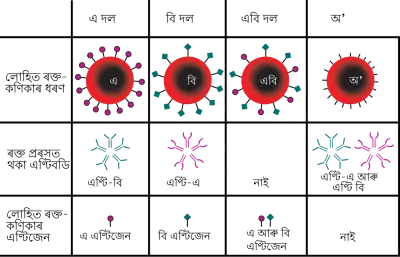
ABO blood groups
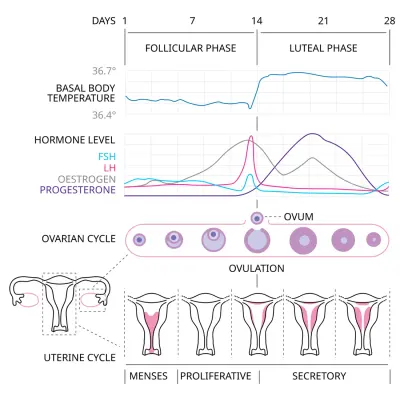
Menstrual cycle (hormones)
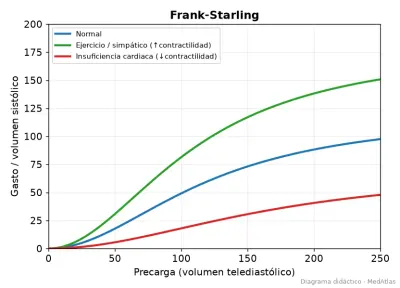
Frank-Starling law
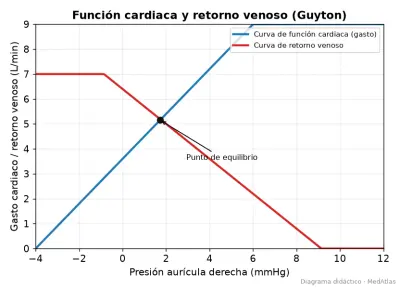
Cardiac function and venous return (Guyton)
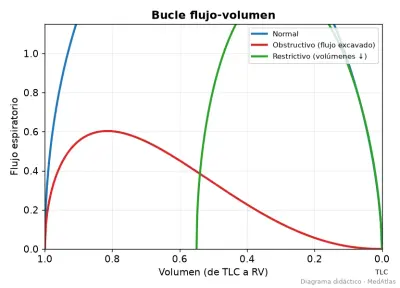
flow-volume loop
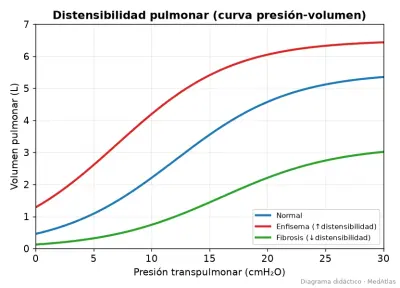
Lung compliance (pressure-volume curve)
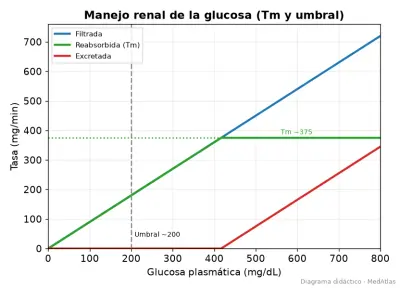
Renal glucose management (Tm and threshold)
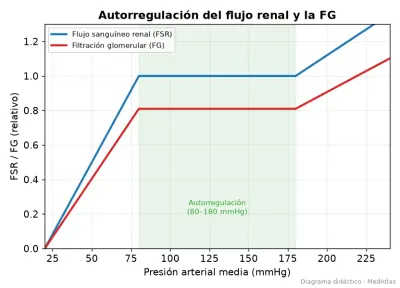
Autoregulation of renal flow and GFR
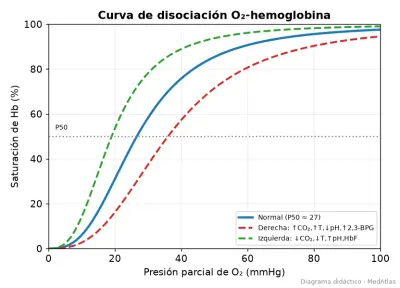
O₂-hemoglobin dissociation curve
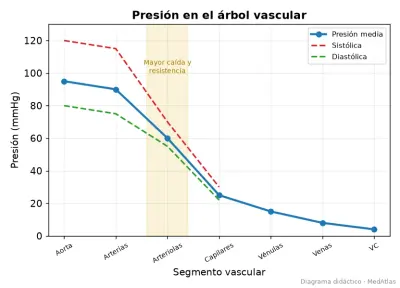
Pressure in the vascular tree
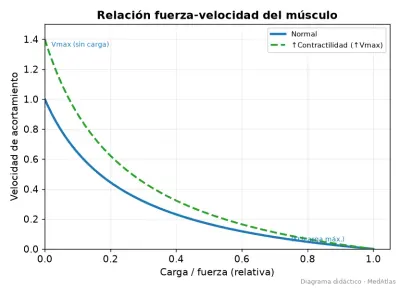
Muscle force-speed relationship
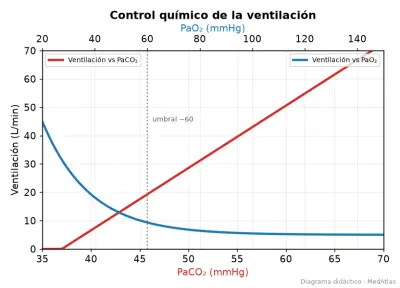
Chemical control of ventilation
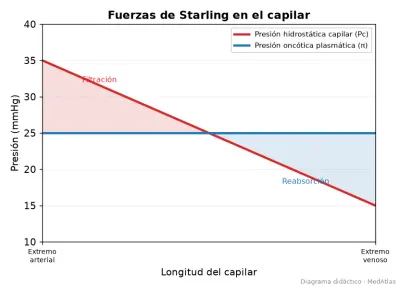
Starling forces in the capillary
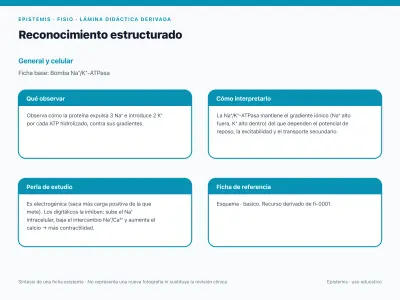
Structured recognition · Na⁺/K⁺-ATPase pump
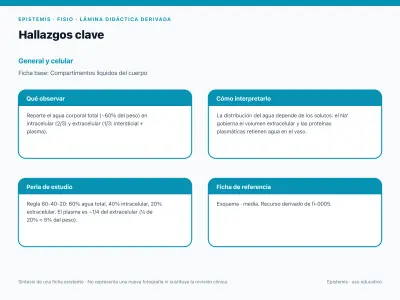
Key findings · Liquid compartments of the body
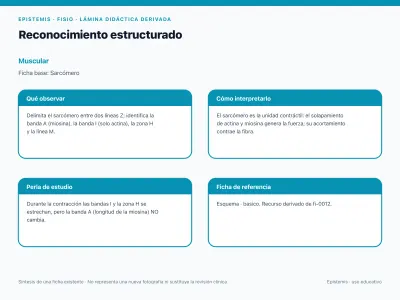
Structured recognition · Sarcomere
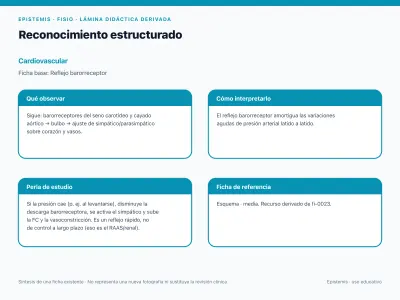
Structured recognition · Baroreceptor reflex
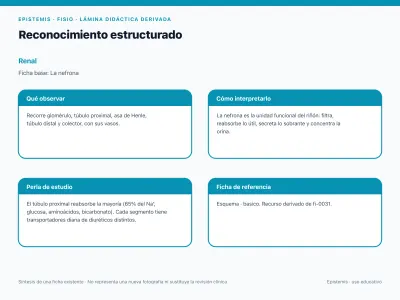
Structured recognition · The nephron
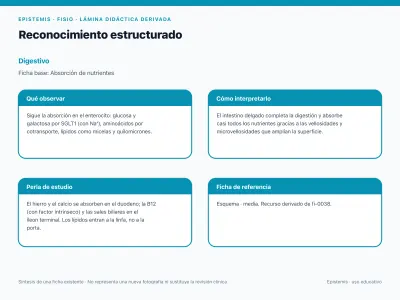
Structured recognition · Nutrient absorption
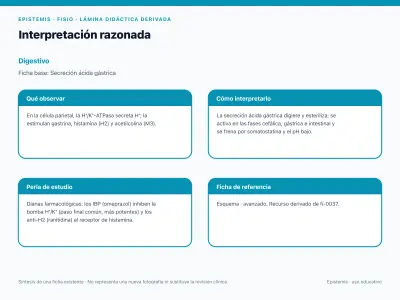
Reasoned interpretation · Gastric acid secretion
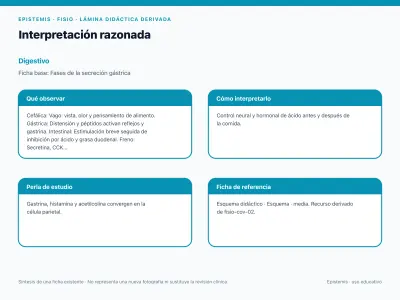
Reasoned interpretation · Phases of gastric secretion
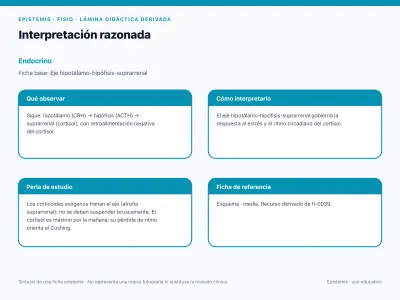
Reasoned interpretation · Hypothalamic-pituitary-adrenal axis
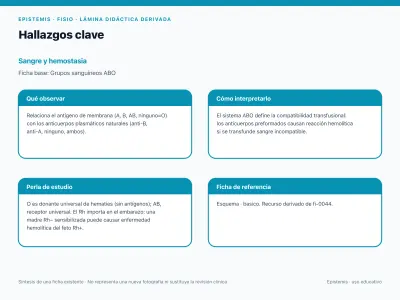
Key findings · ABO blood groups
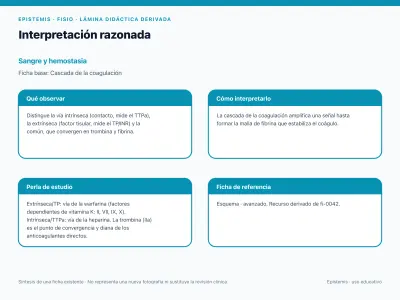
Reasoned interpretation · Coagulation waterfall
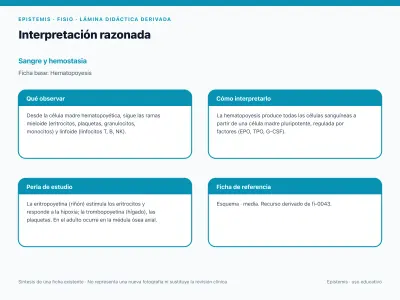
Reasoned interpretation · Hematopoiesis
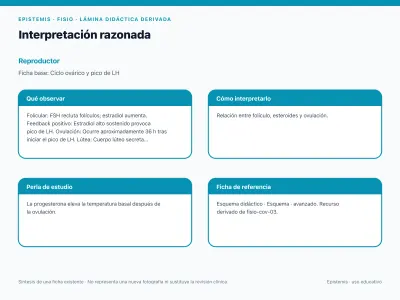
Reasoned interpretation · Ovarian cycle and LH surge
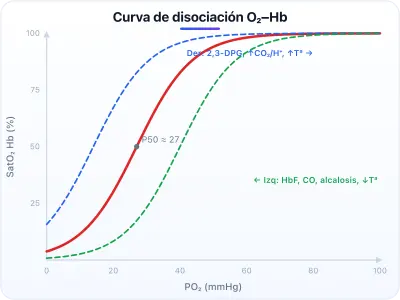
Oxyhemoglobin dissociation curve
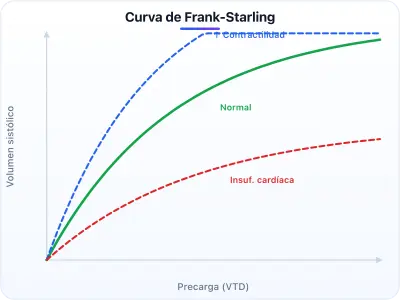
Frank-Starling curve
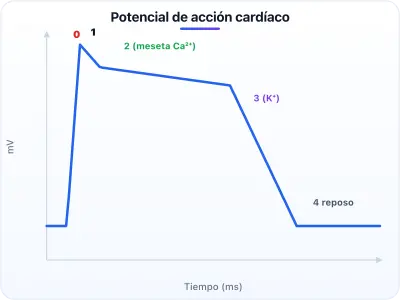
Cardiac action potential (phases 0-4)
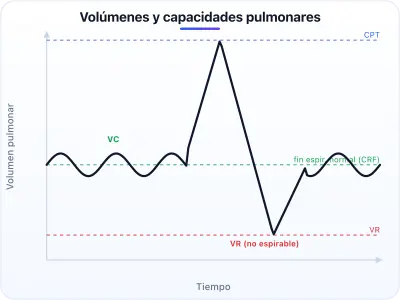
Lung volumes and capacities (2 of 2)
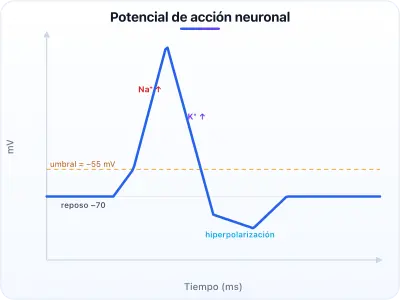
Neural action potential
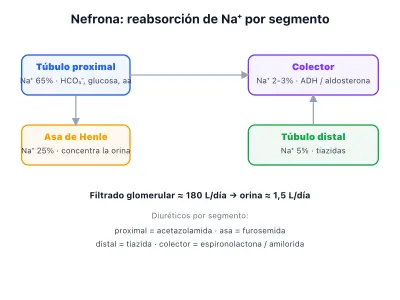
Nephron: sodium reabsorption per segment
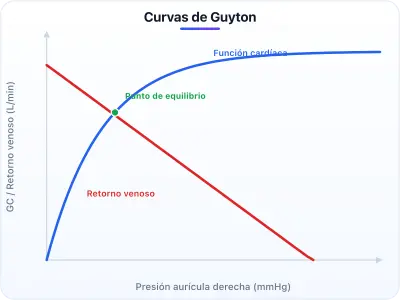
Guyton curves: cardiac function and venous return
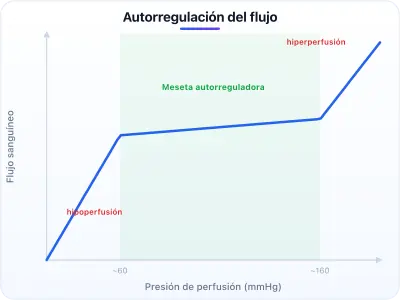
Autoregulation of blood flow
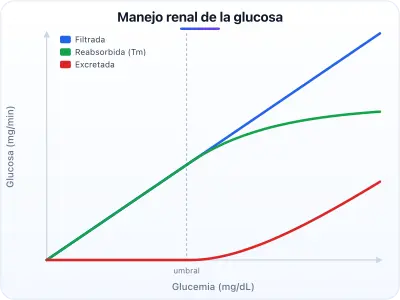
Renal glucose management (maximum transport, Tm)
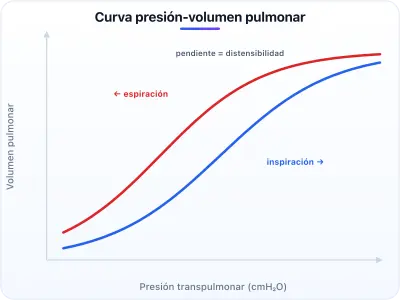
Lung pressure-volume curve (compliance and hysteresis)
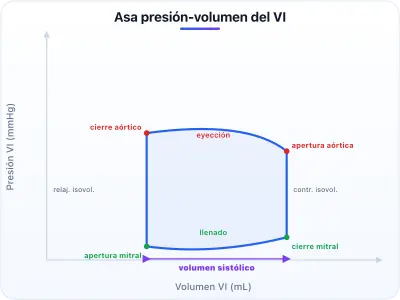
Left ventricular pressure-volume loop
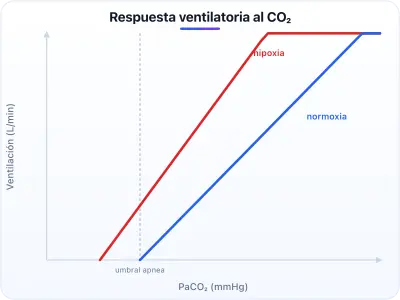
Ventilatory response to CO₂ (role of hypoxia)
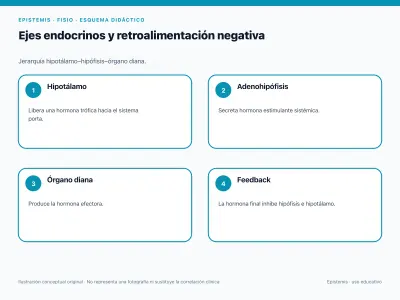
Endocrine axes and negative feedback
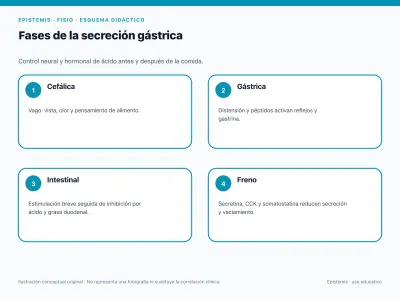
Phases of gastric secretion
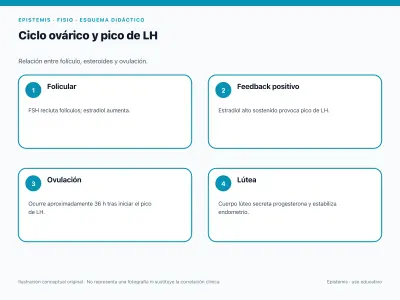
Ovarian cycle and LH surge
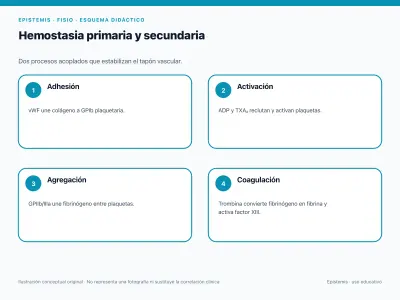
Primary and secondary hemostasis
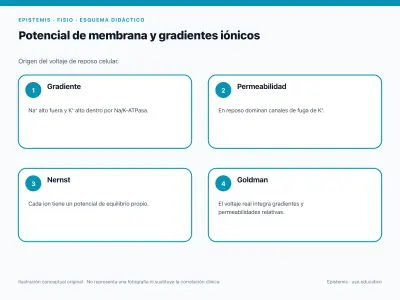
Membrane potential and ion gradients
No cases match those filters.